|
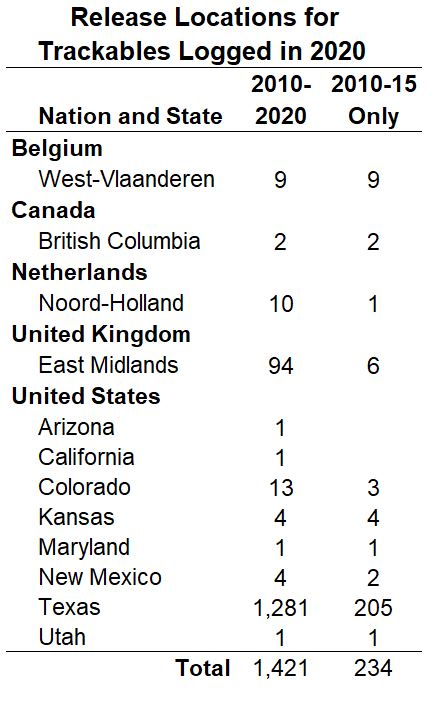
RELEASE LOCATION
The general release locations for the 2020 trackables are shown in the table at right. The first column is the nation and state (or province) of the release. The middle column shows the location counts for all the trackables among the 2020 logs. The last column shows the counts for only the oldest trackable cohort, which will be discussed more fully later in this document. Although I personally made a few of the drops in Belgium and the Netherlands, there are cachers in those countries, and England, with whom I have traded new trackables. All other drops are mine, done during my own travels. There are two points to make about the table. The first is that, except for Belgium, ratios of drop locations between the last two columns are pretty close. I think it fair to say the third column is a fair sampling of the second. The other point concerns the drops in Texas, which dominates both columns. The respective percentages of the totals are 90.1 and 87.6, an insignificant difference caused by the Belgian and English releases. Historically, my year-to-year Texas releases average 89 percent of the total and, of those Texas releases, only 6 percent of those are outside my core caching area. My core caching area is the 16 counties of the Texas Panhandle and Southern High Plains outlined in red on the map at right. While I have micro cemetery caches both east and west of these counties, all my high-maintenance, small- to regular-sized, trackable-bearing caches are in the core area. |
|