LAST LOCATION
I assume the last log locations to be near the actual location of the travel bug. That may be less likely true for bugs being held by cachers that for other status designations. The names of the last log locations at end of 2020 were obtained from the respective trackable home pages at Geocaching.com. When a state or province was not provided by Groundspeak, notably for Denmark and Finland, national subdivisions were taken from Wikipedia.
The trackable last-locations were divided into three regions of convenience, Asia & Pacific, the Americas, and Europe & Africa. One might get the impression from these group names that the last-locations are distributed evenly throughout the regions, but as will be shown in the tables below, the bulk of the trackables within each of these regions were in Australia, the United States, and northern Europe, respectively.
In the tables for each region, the locations are arranged alphabetically by country, then by states/provinces (if appropriate). In all three tables, there is column for the location counts for all trackables (released 2010 through 2020) and another column for the counts of the oldest trackables (released 2010-15 only). These data will be discussed more fully in a comparison of regional survivorship near the end of this report.
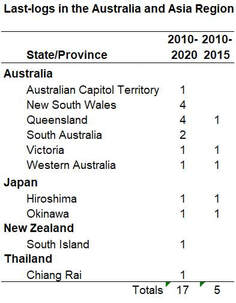
Australia and Asia. The table at right shows the distribution of the last-log in the Australia and Asia region. The 2010-20 columns show the counts of trackables released in those years that also had logs in 2020. The 2010-15 column is the counts of trackables released only in those years. This enables a later comparison of all versus oldest trackables in the 2020 logs. This table format is the same for the tables or the remaining two regions
This assemblage is a contrivance, there are just too few total trackables in a very large area to employ subdivisions relevant to this project. The chief item of notice is there were last-logs in five of the seven major political divisions of Australia. Neither Northern Territory or Tasmania are represented at present, although in the past bugs have been dropped in both. The Australian Capital Territory is an internal district, like Washington DC in the United States.
This assemblage is a contrivance, there are just too few total trackables in a very large area to employ subdivisions relevant to this project. The chief item of notice is there were last-logs in five of the seven major political divisions of Australia. Neither Northern Territory or Tasmania are represented at present, although in the past bugs have been dropped in both. The Australian Capital Territory is an internal district, like Washington DC in the United States.
|
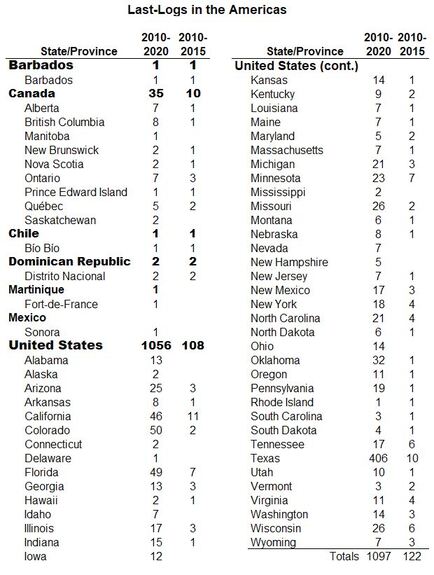
The Americas. The table at right shows the Americas are represented by trackables whose last logs were in seven countries. The totals for each country are in bold, the totals for each respective state or province are not. A total of 1056 of 1097 (96%) were in the United States. Canada’s 35 (3%) is the only other total that materially contributes to the total.The green area on the map below shows my core caching area relative to the rest of the US. The totals from the table at right are within the boundaries of the states (when possible).
If the dispersal of bugs approximated the law of diffusion (concentration decreases with distance), we might expect the fewest number of bugs in the furthest states from the point of release. Indeed, this seems to be the case if we follow a line from the core area up through the Plains states into Canada…North Dakota is a slight break in the trend. Similarly, another line from the core area to Illinois shows the same pattern. However, the distribution throughout the rest of the country effectively scotches the notion of a uniform clinal pattern centered on my core caching area. Texas has the greatest number. Aside from the obvious fact that nearly 90% of my trackables start here, the size of the state makes it difficult to leave, except by large jumps. |
|
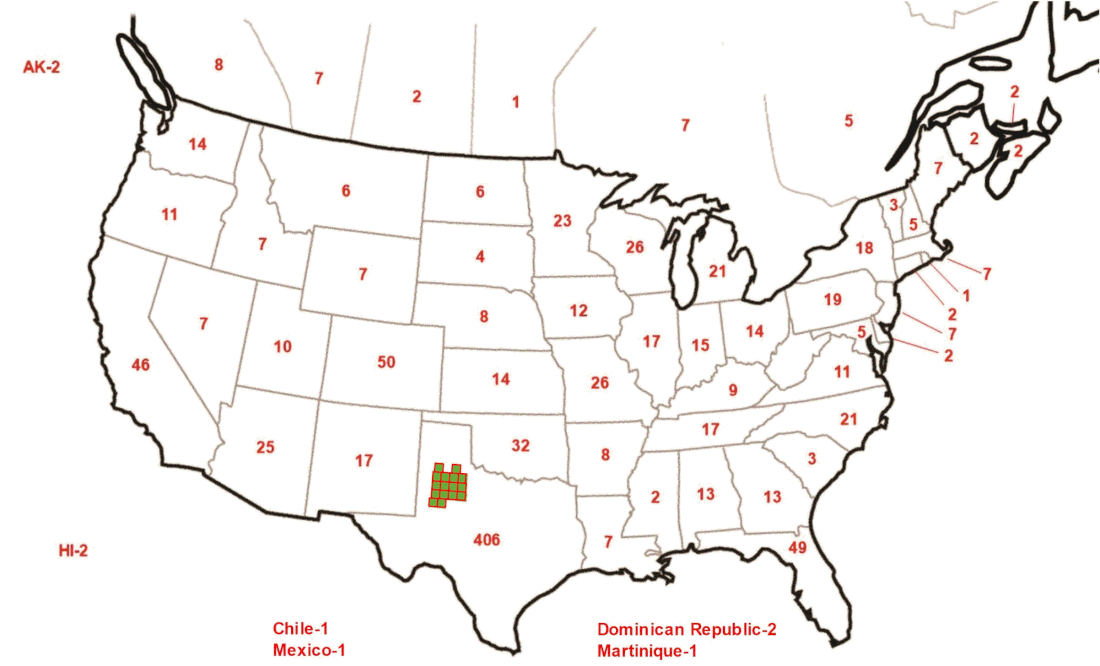
While my core area is near New Mexico and Oklahoma, the bulk of my bugs travel east and southeast first, to the population centers of the state. The transporters are most often visitors working on their Texas county challenges, or are the caching parents or grandparents of students at area colleges. Also, some number of my trackables will leave the state for some period, then return.
Geographically speaking, there are conspicuously high numbers of trackables in nearby Colorado and the more distant states of California and Florida. Moreover, in past years I have noted the high concentrations in Wisconsin, but in a possible anomaly, the 2020 numbers in adjacent Minnesota and Michigan are nearly as high. Similarly, the number of trackables in the southern Appalachian states have increased in recent years. Clearly my TBs get to some regions more than others and it is not because of population density.
The reader must bear in mind that these state occurrences are not just from activity in 2020, nor does the distribution only result from direct travel from my core area. I have no single explanations for the observed distribution. However, what I do have are some thoughts that originate with comments cachers leave in my cache and trackable logs.
- Texas, California, Colorado and Florida leisure destinations for caching couples and families. Once there, caching remains one of the activities.
- My core area lies area lies across preferred routes of summer and winter travelers between the mountains of New Mexico and Colorado and sites in central and south Texas.
- Caching retirees from the US Midwest and pre-Covid Canada drive or tow RVs through my core area to/from wintering grounds in southern Texas, New Mexico, Arizona and southern California. They avoid heavy traffic, narrow highways and mountain travel.
- There are many instances when itinerant cachers will stay in my core area for weeks at a time. Some are workers, like those installing wind and solar farms, others are retirees. This demographic will take up brief residences in the small RV parks that have popped up in the area. For some period, they make day trips from their bases, then move on, taking bags of trackables with them.
- Finally, I have been at the game long enough log enough to know that my caches are increasingly known to, and targeted by out-of-area cachers. Furthermore, I have a small, faithful clientele that visits the same caches once or twice a year, just to make TB exchanges.
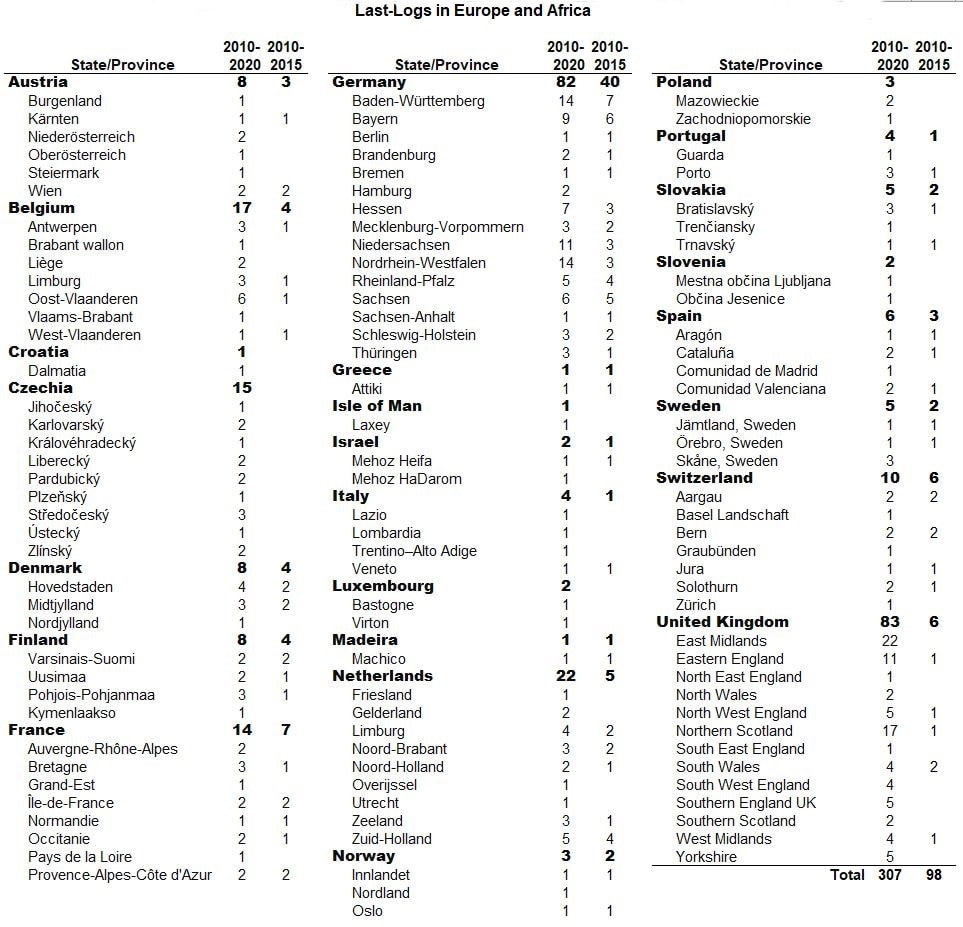
Europe and Africa. The table below shows the number of last-logs in some of the countries in Europe and Africa. The totals for each country are in bold, the totals for each respective state, province, canton or kraj are not. The national totals are also shown on the map following the table.
|
The combined Europe and Africa region is represented by trackables in 24 countries, including the Isle of Man and the Madeira Islands. The United Kingdom (83 trackables) and Germany (82) together harbor 165 of 307 (54%) in the region. The number swells to 75% (231/307) If we combine the trackables in all of Northern Europe…those countries bordering on the North and Baltic seas.
A few words about similar large totals of the United Kingdom and Germany. I have never been to the UK but I have a friend in England with whom I have exchanged unreleased trackables over several years. Most were later released at hosted events or in his own caches. A total 61 of the 83 (73%) trackables in the UK were released in the East Midlands. A total of 15 (18%) were released in Texas. |
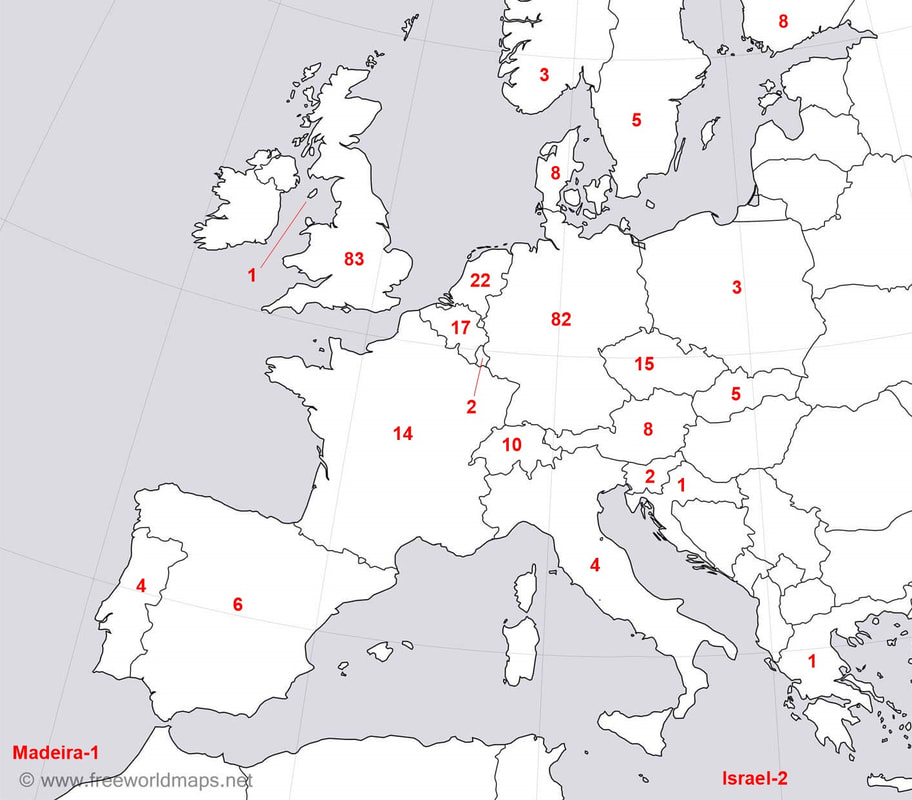
|
On the other hand, I have neither been to Germany, nor have I exchanged TBs with anyone there. However, of the 82 of my trackables in that country at the end of 2020, four (5%) were released in the UK, and 62 (76%) were released in Texas. At the end of last year, there were more of my Texas-released travel bugs in Germany than in any state in the US, except Texas. Clearly, without any help from me, my trackables will concentrate in Germany. A closer look at that theme is found under the next tab, RELEASE/LAST.