I have suggested that trackables move more frequently in Europe than here in the US. Shortly, I will start an examination of a larger sample of all my oldest trackables, the results that should put the issue to rest. In the meantime, we have enough information at hand to at least illustrate some consistent differences between the regions.
Drops are the denominators in my determination of frequency. The term is an artifact of my original record-keeping, when I rigidly recorded only TB placements into a container. I ignored all other occasions when a trackable changed possession, like hand-offs or when dropped at an event. I quickly realized I was not accurately counting what I actually wanted to know, which was was the number of abrupt changes of risks a trackable encounters. I now record all changes of possession, but I have not concerned myself with finding a better term because the majority of the time, a drop is just that. However, it should not be taken literally. By itself, I use the number drops as an expression of endurance. Every drop represents a set of risks successfully negotiated.
I define frequency as the average time interval between drops. Some part of that interval may be in cache, some in a cacher's pocket. My spreadsheets calculate days from release after each trackable drop. The total drops divided into total days gives the average days between drops. The fewer average days between drops means a higher drop frequency.
For this exercise, I studied only my oldest travel bugs, those released 2010 through 2015. In addition to being a more manageably-sized cohort, the average number of drops per trackable is higher, yielding more accurate averages. I performed the crudest of sorts of these trackables, based only on the last-log locations. This means some trackables in one category may have spent some time in the other category.
Of the 234 trackables, 113 were last located in the US and Americas, while 121 were in the Europe and world category...those are surprisingly close to the same. It is perhaps telling that, of my oldest active trackables, slightly over half were not in the United States, the country where 95+ percent were released.
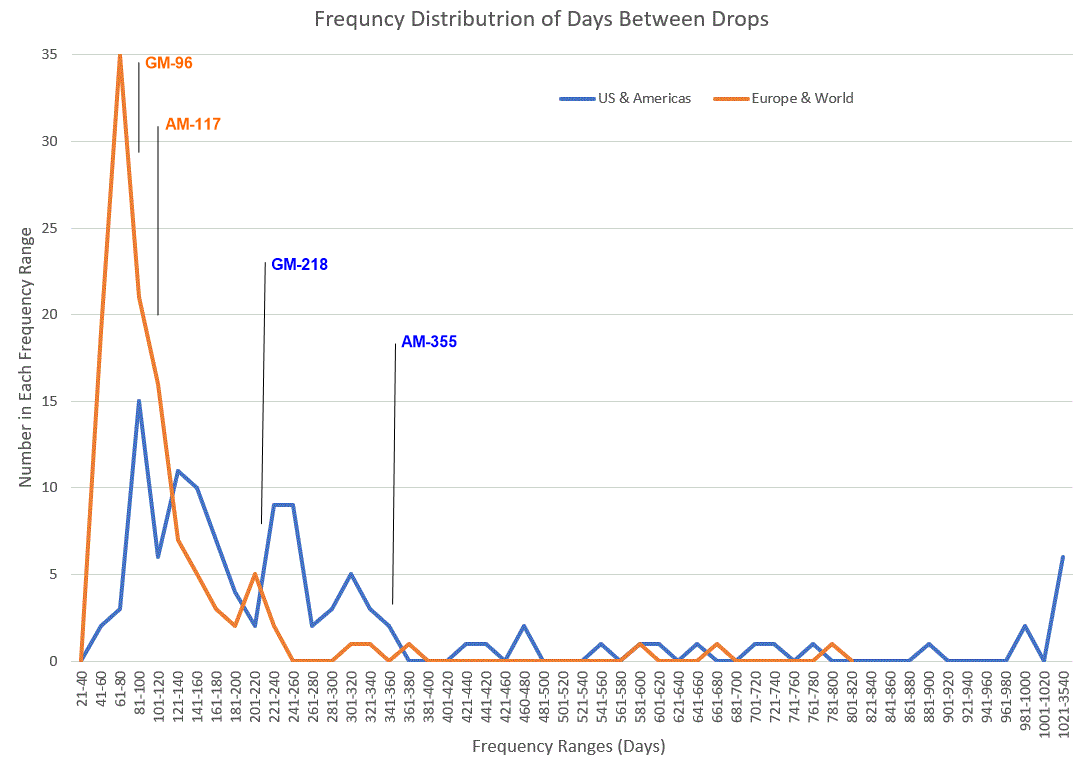
I calculated the frequencies for all trackables in both data sets. There are several issues with the data. The range of frequencies for the US and Americas was 54 to 2540 average days per drop, while Europe and the World had a range of 42 to 788 days per drop. These ranges are huge and difficult to present using the single values. To reduce the histogram above to page-size, the frequencies were sorted into ranges of 20 values, before counting.
The orange line and numbers are for Europe and World sample, whereas the blue is for the US and America. Both data sets have supremely skewed distributions, meaning most of the values are at one end of the range. This makes a quick characterization of the samples with basic descriptive statistics almost meaningless. An arithmetic mean (see the AM in the graph) does not approximate an "average" value. The standard treatment of skewed data is calculating geometric mean (GM) which minimizes the extremes with a log conversion. That calculation was only a modest improvement. By either method, the Americas sample is at least an order of magnitude greater than the Europe counterpart, 218 days to 96 days for the geometric mean, 355 to 117 for the arithmetic mean. Thus, it appear that frequency intervals are far, far larger in the Americas than outside the Americas, or, said another way, trackables in Europe and the World category move more often.
Qualitatively the curves are very different. The Americas curve is very erratic with no single distinct peak. The Europe curve does have a distinct peak, suggesting there is an imperative to drop off trackables at around 100 days, or certainly before 160 days have passed. That is not the case with the Americas sample.
The trickle of trackables on the right of the curve is evidence of my flawed sample selection process. On both curves, every one of the trackable beyond 341-360 days has fewer than three drops and beyond 501-520 days have only one drop. My trackable with the 3540-days value was new and was retrieved from cache almost ten years ago and has never been dropped off, thus the meter continues to run without interruption. Clearly, my future study must have larger sample sizes in order that I not include bugs with too few drops. This will have the effect of minimizing a few extreme means.
Yet another problem is the casual sort on last location. On the orange curve, I spot-checked trackables 201-220 range and, while their last-log was in Europe, they had many previous drops in the Americas. Thus, the selection of samples in the future must include trackables scrupulously sorted into three categories, Americas only, World only and both. Making all these corrections should produce two smooth and one ragged curve.